- Web analytics is the backbone of any successful web strategy. With regular web analytics data collection and analysis, you’ll know how to make evidence-based decisions that strengthen your web strategy.
- When properly implemented web analytics can save organizations millions. Companies routinely see boosts in revenue and cuts in operating expenses by using insights gathered from data.
- Data collection Measurement Analysis Reporting Each component to web analytics is critical to developing a complete picture of user interactions and overall website performance.
- Understanding user behavior helps customize content and improve user engagement. By analyzing visitor interactions, you can identify trends and preferences that inform your marketing efforts.
- Web analytics is crucial for optimizing conversion rates, as it identifies barriers to conversion and tracks success metrics. This ongoing measurement allows you to adjust strategies and enhance the user experience.
- Using insights from web analytics can guide future investments and content strategies. By continuously monitoring performance, businesses can make strategic, user-centered decisions that align with changing market conditions.
What is web analytics

Credit: ezylearn
Web analytics involves collecting and analyzing web data to understand user behavior and enhance website performance. It includes measuring, collecting, and reporting data, which helps companies of all sizes assess user engagement and gain insights into how visitors interact with their sites.
These insights are key to understanding how to make educated decisions about improving your site and overall marketing efforts. Tracking user interactions can show how visitors navigate through a website, revealing which pages attract attention and which ones may need improvement.
For example, an eCommerce site might notice that a product page has many visitors but few purchases. By optimizing this page based on that insight, they can enhance user experience and increase sales. Web analytics supports these data-driven decisions, equipping organizations to better connect with their customers.
Web analytics has come a long way from its early days of simple traffic analysis. The traditional approach to web analytics is based on server log file analysis. This method consists of looking at the logs that a web server generates for every single request from browsers.
However, most companies execute this strategy internally. It looks at what content on the site is earning the majority of all traffic—50% or more! Today, in addition to the more traditional measuring techniques, web analytics has grown to include more sophisticated techniques, like page tagging.
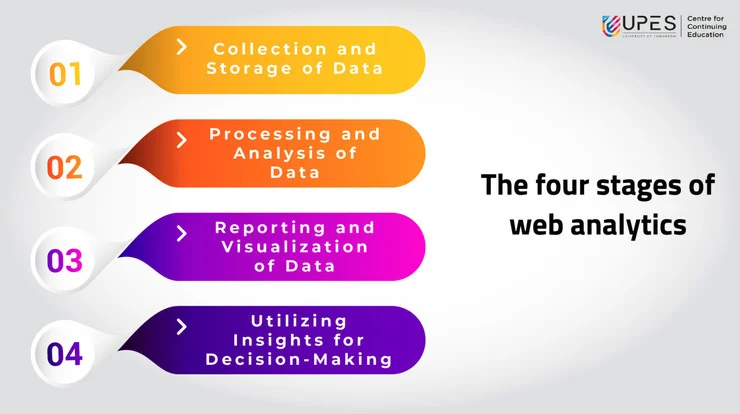
Setting a page tag helps ensure a more accurate understanding of user interactions. It provides more granular understanding of visitor recency, the time elapsed between their most recent and current visits. Most web analytics processes boil down to four essential stages: collection of data, developing key performance indicators (KPIs), analysis, and reporting.
Each step is critical to making sure that companies can measure their success and make data-driven decisions to pivot their strategy when necessary.
Key components of web analytics
Web analytics involves gathering and examining data from a website to understand and impact user behavior. It consists of four main components:
Credit: upesonline
1. Data collection methods
Data collection is the first step in the web analytics process. The most common ways are tracking codes and server log files. In the case of web analytics, tracking code—usually deployed with JavaScript—are pieces of code you deploy on your website.
They track user behavior, allowing you to get immediate feedback on what your visitors did on your site. For example, if a user clicks a call or action button or completes a form, the tracking code tracks this conversion.
Maintaining data integrity, accuracy and reliability is imperative. If you have tracking codes installed improperly, they will mess up your data. Further, issues with the server log files can lead to inaccurate and incomplete insights into user behavior.
This ensures poorly informed decisions. Maintaining data integrity through the best data collection practices, like regular audits and A/B testing, is key to clean data.
2. Measurement techniques
Next, we focus on measurement methods. Key performance indicators (KPIs) are essential for assessing success, while metrics provide detailed insights into user intent and behavior.
By tracking bounce rate, you can see what percentage of your visitors are leaving without visiting any other pages. This metric is incredibly helpful to understand user engagement.
Quantitative data is crucial for assessing a website’s performance. Regularly measuring these indicators helps you track progress and identify trends over time.
This continuous process of evaluation helps you make better, data-driven decisions about how to improve your website and new marketing strategies to deploy.
3. Analysis processes
After the data is acquired and measured, the analysis processes start. This step is what turns all of that raw data into actionable insights. By analyzing behavioral data, we can better understand how users interact with our content, allowing us to uncover user preferences and pain points.
If your customers would rather text or chat with your company’s representatives, this knowledge can help shape their customer service strategies. Providers use this data to improve their customer service strategy.
Interpreting analytics data is not simple. With their business acumen, their expertise helps ensure that insights drive business strategies, so that teams can more effectively optimize user experience and better satisfy customer needs.
4. Reporting formats
Last but not least, reporting formats are what makes the data come alive. Dashboards and visual reports have become the standard formats for presenting data in a way that tells the clearest, most effective story.
Visualization techniques, such as charts and graphs, help stakeholders quickly grasp complex information. Customizing these reports to meet the specific needs of decision-makers makes them even more relevant and effective.
Insights gained from web analytics
Web analytics provides valuable information about user interactions and overall site performance. By converting data into clear insights, businesses can enhance their strategies and improve the user experience.
Here are key insights gained from web analytics:
- Understand user behavior patterns and preferences.
- Identify website performance issues and areas for improvement.
- Optimize marketing strategies based on user engagement metrics.
1. Understand user behavior
Just analyzing user behavior data can show you patterns in how people are using your site. This new analysis reveals what content is attracting users, how long they are spending on the site, and where they are most likely to exit.
A large volume of users dropping off a product page without a purchase means something is definitely wrong. This sends a clear message that there is room to do better. Using this knowledge, companies can produce the most relevant content that speaks directly to user needs, increasing engagement at every turn.
Understanding user demographics, including age, location, and interests, enables more effective and targeted marketing campaigns that speak directly to your ideal audience. Tools such as Google Analytics provide valuable perspective. This data is incredibly useful in helping teams develop content that aligns with what users are specifically looking for.
2. Identify website performance issues
Web analytics can be used to identify performance issues like high bounce rates or slow loading times. For example, a site that takes more than three seconds to load could lose up to 75% of potential visitors.
Then we need to implement corrective measures based on these findings. Properly size and compress images, and minify CSS and other code to increase overall site speed. Keeping a pulse on changes across performance metrics is critical for evaluating the success of these optimizations.
Taskworld went straight to the source of their biggest problems. In return, they experienced an astounding 40% increase in conversion rate and 4.5% decrease in customer abandonment.
3. Optimize marketing strategies
By using web analytics, businesses can optimize their marketing efforts by focusing on the content and formats that drive engagement and conversions. Identifying successful marketing channels and campaigns through detailed traffic source analysis enables teams to focus their efforts on what truly works.
Adjust your marketing strategy on-the-fly based on data that’s happening right now! Put those insights to work to better engage with your target audiences and help them successfully complete your priority conversions.
4. Enhance user experience
In the end, improving user experience is what it’s all about. Understanding visitor behavior and reaction helps identify what’s working and what still needs to be improved.
By making changes to website design and functionality informed by these insights, user engagement can be continuously improved upon. Regularly monitoring user engagement metrics helps to make sure that continued enhancements are increasing usability and supporting user needs and preferences.
Discover how web analytics can transform your understanding of user behavior, and supercharge your results with our expert Performance Marketing Services.
Applications of web analytics in decision-making
1. Drive Business Improvements
Web analytics provides actionable information that makes the business better. By exploring metrics such as page views, user demographics, and bounce rates, companies can identify areas for growth. For example, an e-commerce site may find that 80% of their shoppers leave without checking out.
This new information gives the business the opportunity to research the checkout experience, implementing alterations that lessen drop-offs. In addition to improving the bottom line, data-driven strategies improve customer experience and customer loyalty.
For instance, if analytics show that mobile users are more engaged, a company might focus their efforts on improving the mobile experience. This strategy, which addresses customer individuality, enhances customer experience across the board. Regular evaluations of web analytics help inform, quantify, and qualify the effect of these initiatives.
If businesses compare their data over time, they can visibly monitor the impact of their strategies on web user engagement and in-store sales.
2. Inform Content Strategy
Understanding visitor behavior is critical to creating the right content that drives action. By analyzing the pages that bring in the most traffic, you can learn a lot. These learnings inform planning for interesting blog topics and overall content development strategy.
If a brand finds that content on healthy recipes is performing, they can explore that content further. This provides them the ability to produce even more compelling content that connects with their audience.
By focusing content strategies around insights gathered from web analytics, organizations can create content that more effectively meets the needs of their audiences. If your analytics indicate users are spending more time engaging with video content, then it’s logical to shift more resources toward video production.
Keeping an eye on content performance metrics, including social shares and comments, can help you measure the success of these tactics. This feedback loop is essential for iterative content creation.
3. Support Conversion Rate Optimization
Web analytics is essential to driving down the overall cost of web-based customer acquisition. By identifying obstacles to conversion, such as unclear navigation or delayed page load speeds, businesses are able to make data-driven improvements. Analytics might indicate users consistently fall off at one particular step in the registration process.
By removing that barrier, or at least making that step easier, you can dramatically improve sign-up rates. By tracking these conversion metrics, businesses can determine success more effectively.
If a change results in more patrons signing up or buying directly, those metrics prove that the change was worth making. Using data to optimize marketing funnels allows for data-driven decision making that can increase conversion rates by tweaking and adjusting marketing funnels.
By knowing at what point potential customers drop off, brands can improve their messaging and offers to encourage users to continue on their journey.
4. Guide Future Investments
Using these insights to guide web analytics investments smartly informs strategic investments in technology and resources. For example, a business may find that upgrading to a quicker hosting provider improves the user experience. This positive impact is reflected in reduced bounce rates.
With a full analytics reporting suite, you can start to evaluate the ROI of your web projects and campaigns. It’s important to make evidence-based decisions about what projects and campaigns to pursue in the future.
Historical data trends provide a roadmap for what has worked in the past, guiding future strategies effectively.
Conclusion
Without web analytics, you wouldn’t have an accurate picture of how your website is performing. It allows you to follow the path of each visitor, gauging their level of engagement, and uncovering what’s effective and what’s not. Understanding all of this allows you to make informed decisions that significantly increase your web presence. You can better personalize your content, create a more effective user experience, and drive more conversions. Each of these insights directs you towards more informed decisions for your brand.
With web analytics, you have the power to unlock your audience’s secrets. Swim, don’t sink, through the data and trends, and leverage them to inform your approach. Begin to capitalize on these findings to improve your site. Don’t let success find you—go out and find it yourself. Don’t let the data intimidate you, take charge and make the data work for you!
Frequently Asked Questions
What is web analytics?
Web analytics is the process of measuring and analyzing web data to gain insight into user behavior. Further, it allows organizations to maximize their digital strategy and make sense of their user’s journey.
Why is web analytics important?
Web analytics is the foundation for data-driven decision making. It enables companies to monitor performance, spot trends, and improve marketing efforts for increased ROI.
What are the key components of web analytics?
The four main elements are data collection, user behavior tracking, reporting, and analysis. These aspects allow companies to better understand how their website is performing.
How can businesses use web analytics?
Companies can use web analytics to understand what customers want. This makes it easier for them to optimize content, track conversion rates, and improve their overall marketing strategies to drive engagement.
What insights can be gained from web analytics?
Examples of insights are user demographics, traffic sources, popular content, and bounce rates. With this information, organizations can better align their business strategies to deliver what customers want.
How can web analytics aid in decision-making?
Web analytics gives you real numbers to back up your decisions. Through analysis of current web trends and user behavior, businesses can better understand what choices will best serve them and improve their digital marketing strategies.
What tools are commonly used for web analytics?
These can be tools like Google Analytics, Adobe Analytics or Matomo. These platforms provide advanced tools to monitor and analyze your site’s performance efficiently.